
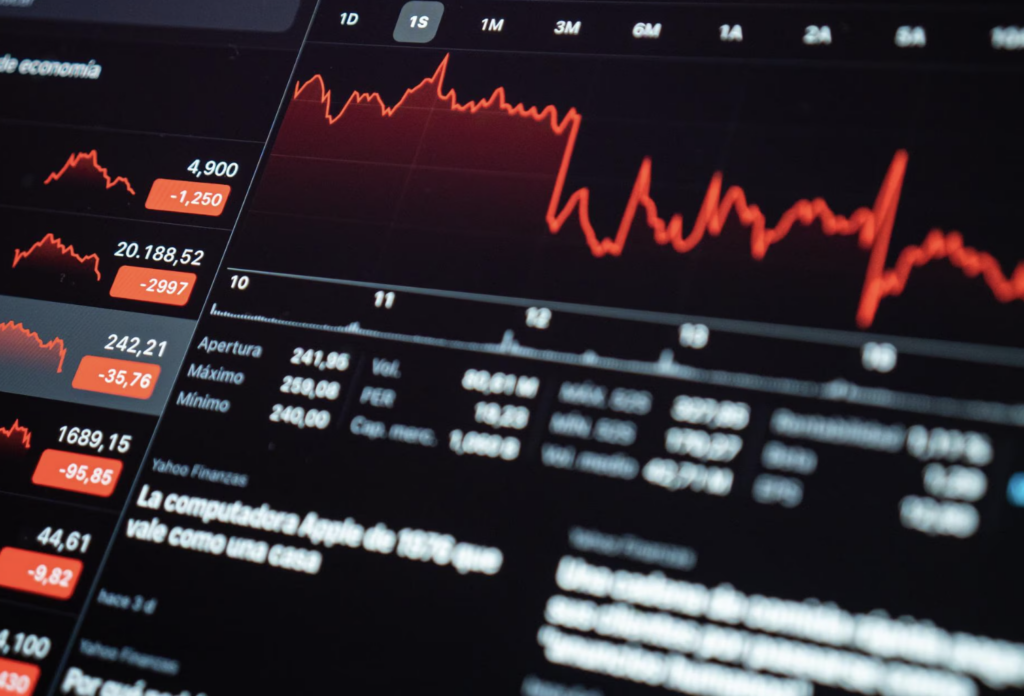
Trading volume helps investors understand how actively a financial asset is being bought and sold during a given period. It measures the number of shares, contracts, or other financial instruments traded within a selected timeframe. Investors use this information to assess market participation, identify changes in interest, and gain a clearer view of price movements. When trading volume rises, it often signals increased activity among buyers and sellers. Lower volume may indicate reduced participation or limited interest in an asset. These changes can offer useful clues about market conditions, though volume alone cannot predict future prices with certainty. Financial products such as UBS Warrants & CBBC provide an example of how trading activity can help investors study market behaviour and understand changes in demand for different financial instruments.
Why Trading Volume Matters to Investors
Trading volume provides several useful insights into the buying and selling process. One of its main functions is helping investors assess market liquidity, which describes how easily an asset can be traded without causing a substantial change in its price. Securities with high trading volume often attract more participants, making it easier to find buyers or sellers at competitive prices. Low-volume assets may be harder to trade, particularly when an investor needs to complete a large transaction. Volume can further help investors assess price trends. When a share price rises alongside growing volume, the movement may reflect broader buying interest. A price increase accompanied by declining volume may indicate weaker participation. These signals are not guarantees, yet they provide additional information that investors can use when evaluating market opportunities and deciding how to manage their positions.
Reading Volume Patterns and Price Movements
Understanding the relationship between price and volume can help investors interpret market activity with greater care. A rising share price accompanied by increasing volume may suggest that buyers are supporting the upward movement. When prices fall and selling volume grows, the market may be experiencing stronger downward pressure. Volume can be particularly useful when a security moves beyond a familiar trading range. This event is often called a breakout, and it occurs when the price moves above resistance or below support. A breakout supported by substantial volume may indicate broader market participation than a similar movement occurring during quiet trading. Low-volume breakouts can be less convincing, since fewer participants are involved. Investors can study these patterns alongside previous price levels, market announcements, and broader economic conditions to develop a more balanced view before making trading decisions.
Trading Volume and Investor Sentiment
Changes in trading volume can provide clues about the attitudes of market participants. During periods of optimism, rising prices accompanied by higher volume may indicate growing confidence in an asset's prospects. Investors may be responding to positive company results, improved economic data, or expectations of stronger future performance. During periods of uncertainty, falling prices with increased volume may reflect widespread selling as investors reduce their risk exposure. High volume does not always indicate a positive or negative outlook, since every completed trade involves both a buyer and a seller. The meaning of the activity becomes clearer when price direction, market news, and broader trading conditions are examined together. Investors who study these factors can develop a more informed understanding of whether a price movement reflects sustained interest, temporary excitement, or a reaction to unexpected developments.
Risks of Misreading Trading Volume
Trading volume can be useful, yet relying on it without examining other information may lead to poor decisions. An unexpected rise in activity might follow a company announcement, an economic report, or a sudden change in market expectations. In other cases, short-lived speculation or concentrated trading by a small group of participants may account for the increase. Volume figures alone rarely explain the reason behind a sudden change. Investors who interpret every spike as a reliable signal may enter or exit positions at unfavourable prices. Another risk arises when volume is unusually low, since price movements in thinly traded securities may become more pronounced when only a limited number of buyers and sellers are active. A careful assessment should combine volume data with price behaviour, company information, market conditions, and the investor's own financial objectives. This broader approach reduces the chance of treating a single indicator as a complete explanation of market activity.
How Volume Differs Across Financial Markets
Trading volume can vary considerably across asset classes, and each market requires a slightly different approach to analysis. In the stock market, changes in volume may reflect reactions to earnings reports, dividend announcements, business developments, or shifts in investor confidence. A sudden increase in trading activity can draw attention to a company, though it does not automatically indicate insider activity or an upcoming announcement. Derivatives markets involve products whose values are linked to underlying assets. Warrants and CBBCs, including products associated with UBS, may attract trading from investors seeking short-term exposure to movements in shares or market indices. Their activity can reflect speculation, hedging, or adjustments to existing positions. Foreign exchange and commodity markets present a different challenge, since trading takes place across multiple venues and complete market-wide volume figures may not be readily available. Investors studying these markets often combine available volume data with price movements, economic reports, and changes in market participation.
The Role of Technology in Volume Analysis
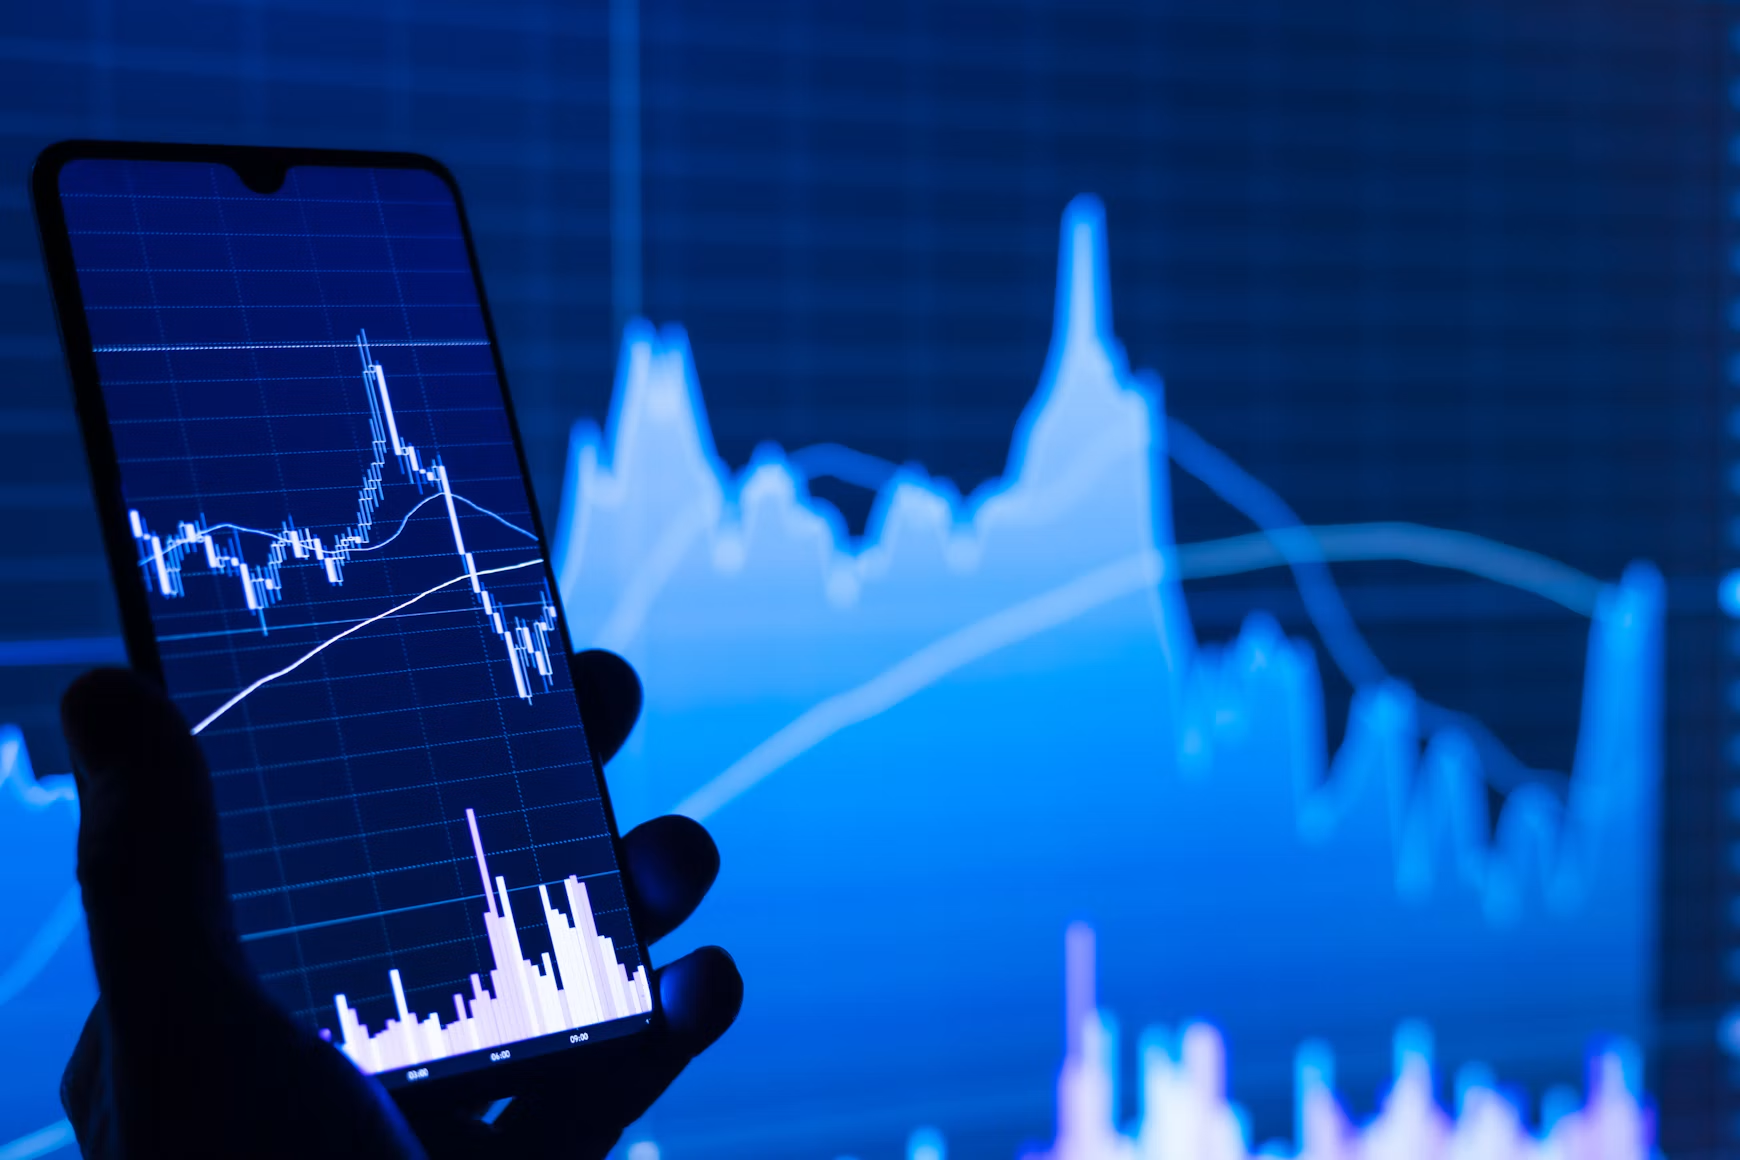
Modern trading platforms give investors access to detailed market information, including live prices, historical volume figures, and analytical charts. These resources make it easier to compare activity across different periods and identify unusual trading patterns. Some advanced systems use automated rules, statistical models, and artificial intelligence to examine large amounts of market data. Such tools can identify changes that might be difficult to spot through manual observation alone. Automated alerts may notify users when trading volume moves above a chosen threshold or when a price breaks through a defined level. These features can support quicker analysis, yet they cannot remove uncertainty from financial markets. Automated systems may produce misleading signals when market conditions change or when the underlying data is incomplete. Investors should understand how their tools operate and review their findings before committing money to a trade.
Conclusion
Trading volume offers investors a practical way to understand market participation, assess liquidity, and examine the strength of price movements. It can help identify unusual activity, provide context for breakouts, and reveal changes in buying or selling interest across stocks, derivatives, foreign exchange, and commodities. Tools such as volume moving averages, VWAP, and relative volume make these patterns easier to study. Still, trading volume cannot explain every market movement or guarantee a particular outcome. Investors gain a clearer perspective when they combine volume analysis with price trends, reliable financial information, economic developments, and sound risk management. By treating volume as one part of a broader investment process, they can make more informed decisions and approach changing market conditions with greater discipline.